

Every influencer platform demo ends on the same screen: a campaign report with a big view count on it. The number is rarely the problem. The problem is what the platform can tell you about where it came from. A view count read today from a video published last spring says nothing about how that video did in its first week, and a report that cannot tell those two readings apart cannot tell you whether the creator you are about to renew is a better bet than the one you dropped.
So the test to run before signing is not a feature checklist. Pick one creator. Follow the decision to book them through to the content they posted, what it cost and what it returned, and see whether the platform still holds the reasoning at the end. If it does, the next campaign starts from evidence. If it does not, the team starts over with a fresh spreadsheet and a vague memory of who was good.
This article is about the software. If the question is which social networks a campaign should run on, that is a different decision, covered in the guide to choosing influencer marketing platforms.
Reporting and workflow have to be judged together because each depends on data the other collects. A report is only interpretable if the objective, the agreed deliverables, the costs and the audience hypothesis were written down when the campaign was planned. A workflow is only useful if the results flow back into the decision about who to book next. A platform that treats these as two products, or as two tabs that do not share a record, breaks the loop at the exact point where it pays off.
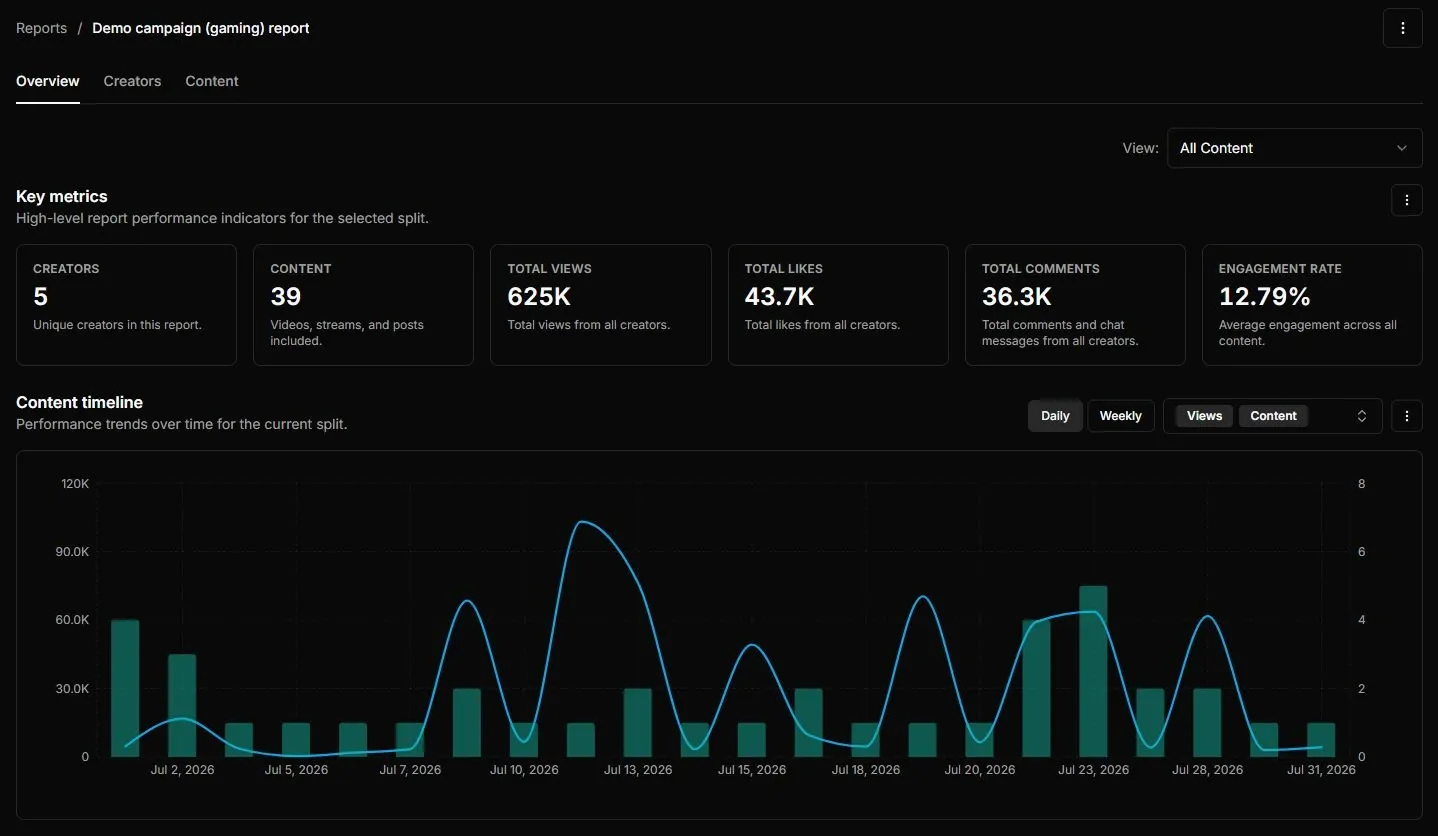
Streamforge’s demo campaign report: creator and content counts, aggregate views, likes, comments and engagement across the campaign, and a daily timeline of views against content published.
Campaign reporting and benchmarking
A campaign report has three jobs. It has to say what happened, it has to say how that compares with a sensible baseline, and it has to point at a decision. Reach and engagement do the first job. The other two need context that most reports leave out, and the demo is the place to ask for it:
- What was delivered, and how old it was when measured. Creator, account, format, URL, publication date, and the age of the content at the time of each reading. A view count without an age is not comparable to anything.
- What it cost and what it did. Tracked clicks, orders or whatever conversion was agreed, next to creator fees, production costs and any paid amplification, with the attribution window stated.
- Where every number came from. The network, the network’s own definition of the metric, the collection date, whether distribution was paid or organic, and what is missing.
The campaign report field guide lays out the full structure. In a vendor evaluation, the useful move is to hand over a real past campaign and ask for those fields back, then export the rows behind the totals. Totals are easy. Rows are where a platform either has the data or does not.
Cross-network reporting is where flattening creeps in. An aggregate is fine as long as the differences underneath it stay reachable: platform, format and measurement source should all remain filters. A TikTok view and a YouTube view are different events, engagement rates with different denominators should never be averaged together, and summed follower counts are not unique reach. Some networks will not return watch time or completion for some content, and when they do not, the report must show a blank rather than a zero. A zero is a measurement. A blank is the absence of one, and a platform that cannot tell them apart will quietly drag every average down. The guide to comparing influencer performance fairly covers how to build groups that can actually be compared.
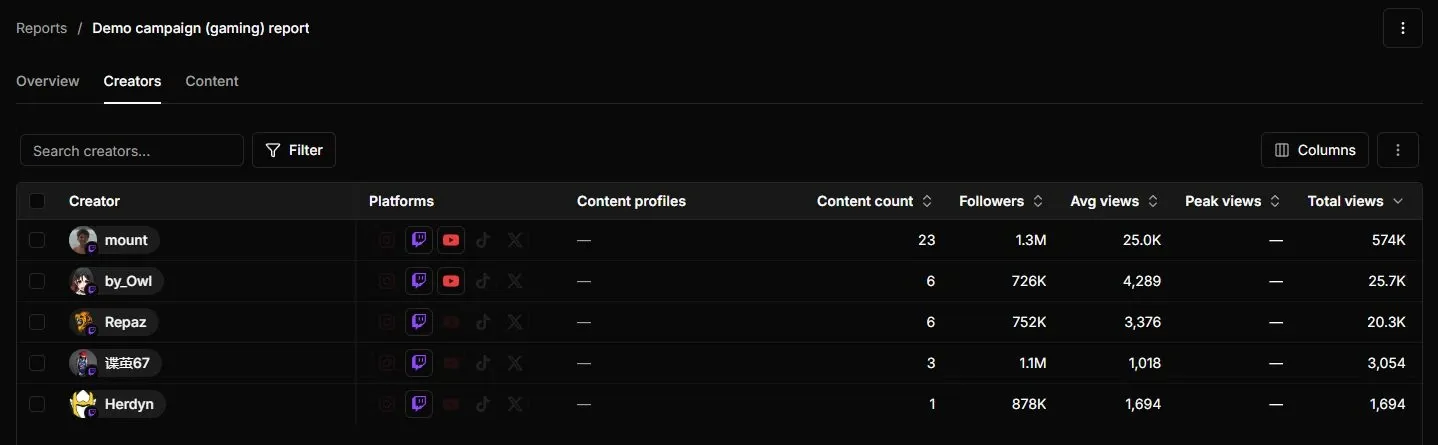
The Creators view of the same demo report, one row per creator with platform indicators, content count, followers and views. Values that were not measured, such as peak views here, show as a dash rather than a zero.
History is the capability to test hardest, because the word covers three different things and vendors use it for all of them. There is a creator’s back catalogue: older posts with whatever view count they carry today. There are performance snapshots: the same post measured repeatedly over time, so its first-week trajectory is known. And there is campaign tracking: content picked up after a campaign starts, on a schedule the platform controls. Only the second and third can tell you how a post performed at a fixed age. Ask how far back each dataset goes, whether campaign tracking can recover content published before tracking began, and whether a closed campaign keeps its underlying records or collapses to a summary.
With real snapshots, the first kind of baseline becomes possible: the creator’s own past. Take a new video’s first seven days and set it against the creator’s previous videos measured at the same age. Keep short-form videos and livestream integrations in separate groups, and keep paid distribution away from organic results. Report the median, the spread and the sample size within each group so one outlier does not become next quarter’s planning assumption. Then make the trend commit to something: renew the creator, change the format, test a different audience, or admit the evidence is thin and collect more.
The second kind of baseline is the market. A creator’s own history says whether they are improving; it cannot say whether your program is keeping pace with the brands competing for the same audiences. That takes a view of what those brands are doing: how many creators they book, how often, on which platforms, and what the resulting coverage is worth on a consistent basis. A campaign report, by construction, stops at the edge of your own campaigns, so if a market baseline matters to the decision it has to be a separate line in the evaluation.
Streamforge covers both. Campaign reporting sits in Streamforge Workflow next to creator discovery and the campaign itself, and Streamforge Intelligence supplies the market view: sponsored-post activity by brand over time, and brand comparisons against industry and competitor averages. Audience analysis is supported across YouTube, Twitch, TikTok, Instagram, and X. Test the reporting against the periods and creator groups your team actually uses rather than the ones in the demo, and read the audience evidence with the audience-analysis methodology to hand. Freshness depends on the source, platform, creator, and field, so check the dates behind any comparison before acting on it.
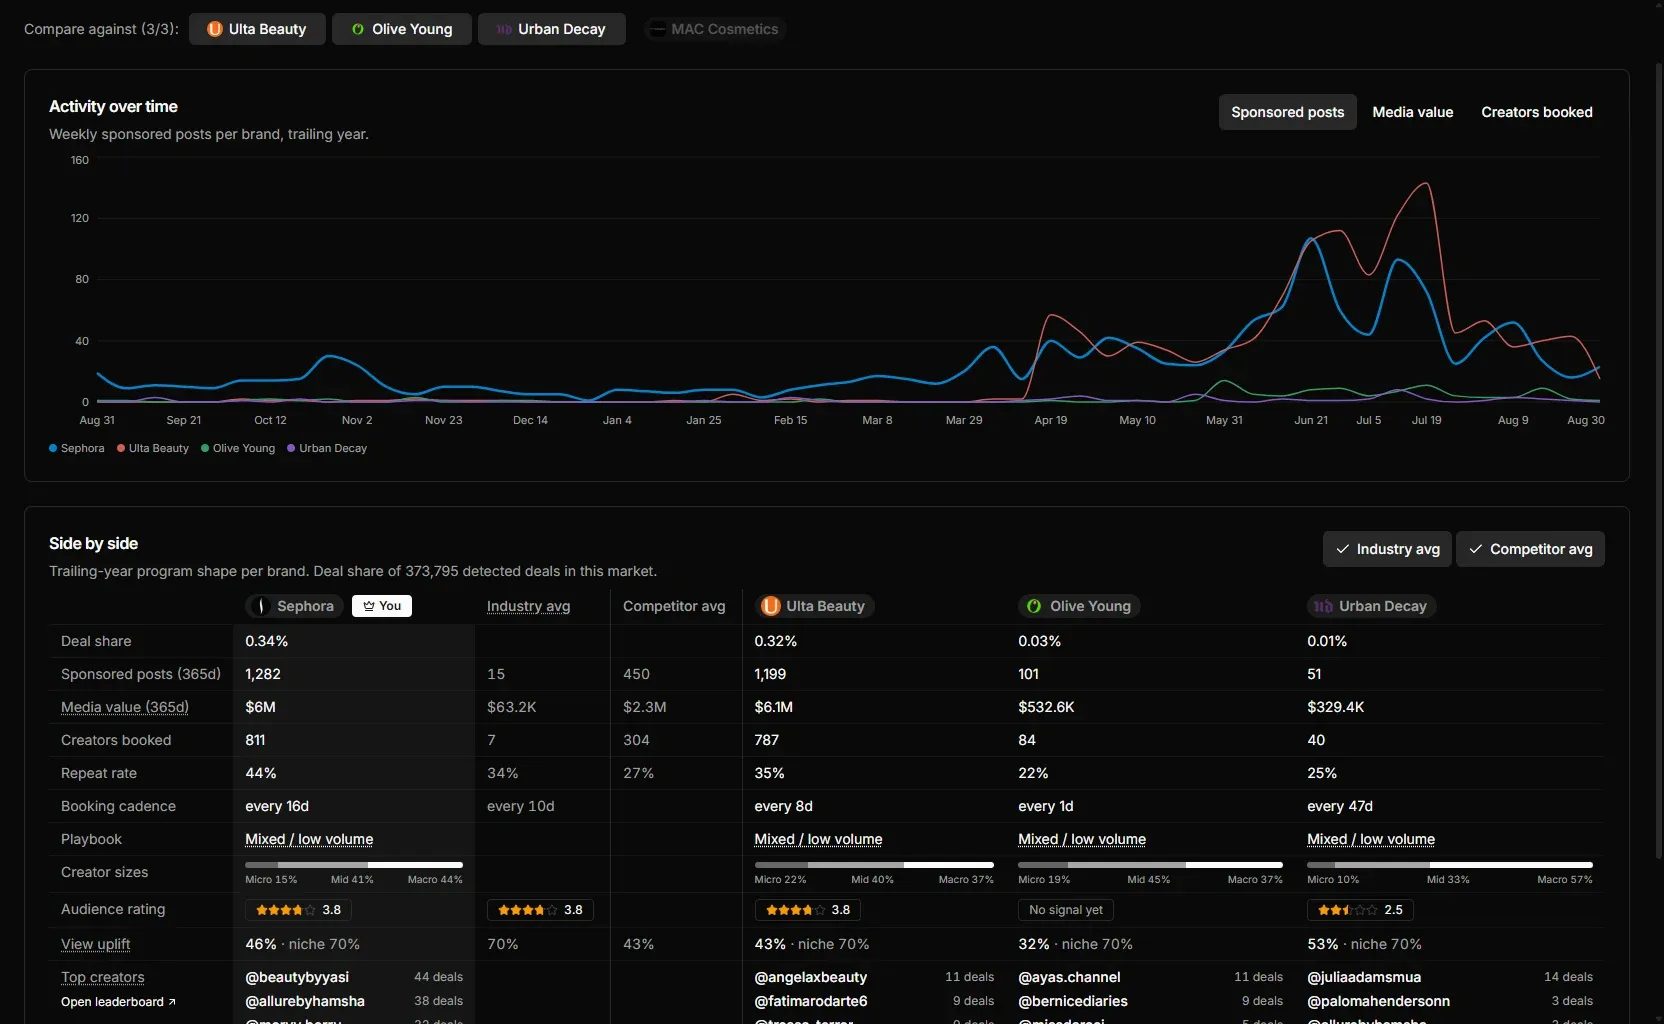
Brand Watcher in Streamforge Intelligence: weekly sponsored posts per brand over the trailing year, and a side-by-side table of each brand against the industry and competitor averages. This is the market baseline, a benchmark of brand activity rather than a measure of any single post at a fixed age.
Whatever platform is on the table, the demo brief is the same. Ask it to rebuild the report for a campaign you already ran, from rows rather than totals. Ask to open a finished campaign and see whether creator rows, per-network metrics and content dates are still there. Ask to see one post at a fixed age against the same creator’s earlier posts. Ask for the same metric on two networks with each network’s definition beside it, and ask where a blank is shown as a blank. A combined score or an automated recommendation is welcome on top of all that. It is not a substitute for the counts, the definitions and the dates underneath. For how Streamforge lines up against a specific tool, the comparison pages take them one at a time.
Unified campaign workflow
A workflow tool is usually sold on stages: a board that shows where each creator sits between first contact and signed deal. Stages matter, but the thing worth paying for is memory. The workflow should hold why a creator was chosen, not just how far the conversation has got, and it should hand that reasoning intact from the researcher who found the creator, to the manager who negotiates with them, to the analyst who reads the results.
The structure that makes this work is simple to describe and rare to find. There is one durable record per creator, tied to their social accounts, that outlives any single campaign. Hanging off it are campaign records: the brief, the deliverables, the owner, the deadlines, the agreed cost, the results. That split lets the team look up every previous collaboration with a creator while keeping each campaign’s terms and performance distinct.
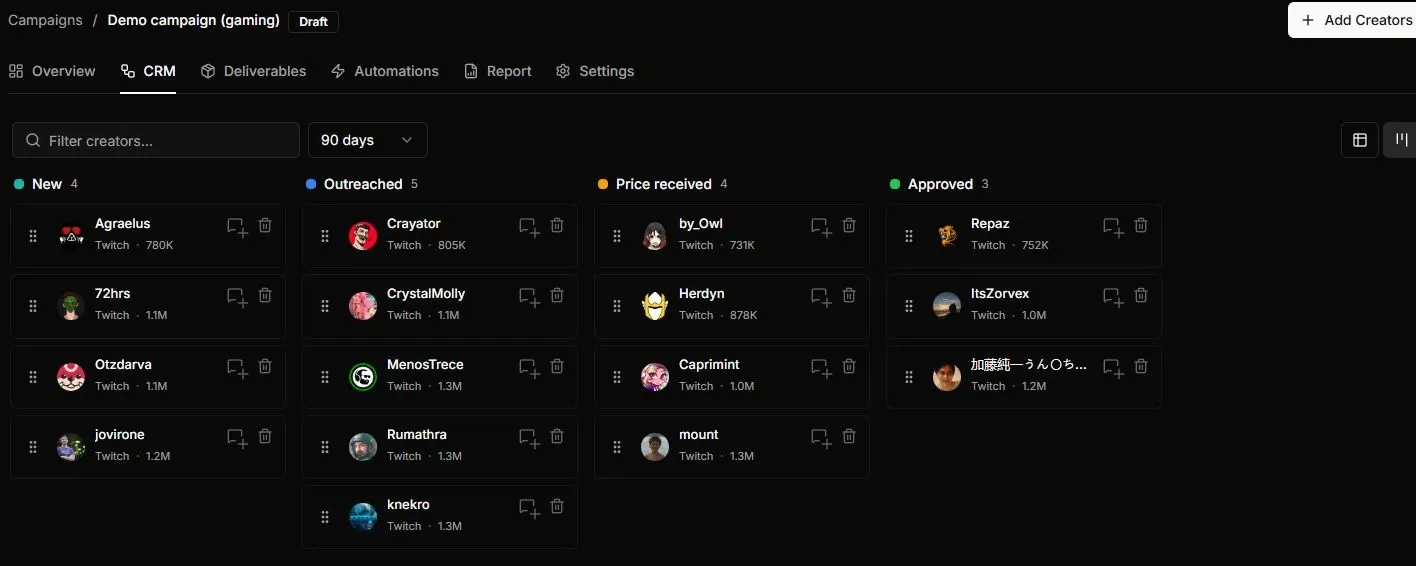
The demo campaign’s CRM board in Streamforge groups creators by stage, from new through outreached and price received to approved. Deliverables and the campaign report are tabs on the same campaign.
The way to test it is to run one real brief through the platform with the people who will actually use it, and watch what survives each handoff.
The researcher goes first. They build a shortlist from the brief, and for each creator the record should hold the role that creator would play, the audience-fit hypothesis and the evidence behind it, when that evidence was gathered, and the questions nobody has answered yet. The creator-shortlist guide sets out that evidence in full, and the post on audience intelligence covers what the hypothesis should be built from. A good check at this point is to ask a colleague who did not build the list to explain, from the record alone, why a creator is on it and what is still unknown. A shortlist that cannot pass that test stores names, not decisions.
The relationship manager takes over next, and this is where most tools start losing information. Outreach happens in email, terms get agreed on a call, and the platform sees only the stage change. The record should still show how the creator was contacted, whether there is a representative, what was said, what was last agreed, and which teammate owns the next move. Once terms are settled, the deliverables, due dates, approval status and the current brief belong on the campaign record, and the live content should attach to it the moment it exists, with a reporting window for each asset.
Contracts deserve their own question, because “contract management” on a feature list can mean anything from a folder to a signing flow. Storing a document, generating an agreement, sending it for signature, tracking signature status and routing approvals are five different capabilities. Ask which ones are in the plan you are buying, and how the signed document stays attached to the campaign and its deliverables. If signing happens in another system, find out how its status gets back into the campaign record.
The analyst closes the loop. When the results arrive, they should land next to the selection evidence, so the audience hypothesis the researcher wrote down can be checked against what actually happened. That is the moment the platform earns its fee: a renewal decision made from the original reasoning and the outcome together, rather than from whichever number is easiest to find.
Streamforge connects creator relationship management and campaign workflow to discovery and reporting, and the demo campaign above shows the shape of it: the CRM board, the deliverables and the report are tabs on the same campaign. Evaluate that connection the same way. Follow one creator from saved research to shortlist, through outreach and campaign planning, to the performance review, and see whether the original audience hypothesis is still attached when the renewal decision comes around.
The platform to buy is the one where, at each of those handoffs, the team could explain both the next action and the evidence behind it. Then build the next shortlist from what that campaign taught you, and run the test again.