


Most influencer programs are planned from the inside out: the brand’s own goals, the brand’s own creator roster, the brand’s own results. Competitive influencer intelligence adds the outside view. It answers which creators competitors are paying, how often, on which platforms, and what that coverage is worth, so a strategy can be measured against the market it competes in rather than against last quarter.
This article covers the two uses that matter most for a brand evaluating an intelligence platform: benchmarking a creator strategy against direct competitors, and mapping the creator partnerships behind a competitor’s activity.
At Streamforge this work is the job of Streamforge Intelligence, which runs alongside the creator discovery and campaign products. It has four parts. Brand tracking catches every piece of influencer content about a named brand, paid or organic, across YouTube, Twitch, TikTok, Instagram, and X. Competitive analysis lays a competitor’s whole influencer operation out by activation, platform and spend pattern. Content valuation puts a value on that coverage, sliced by brand, platform, creator and timeframe so it can be compared across competitors. Industry reports roll it up into category benchmarks with sponsored and organic split out. The rest of this article uses that structure: the benchmarking section maps to content valuation and industry reports, and the partnerships section to brand tracking and competitive analysis.
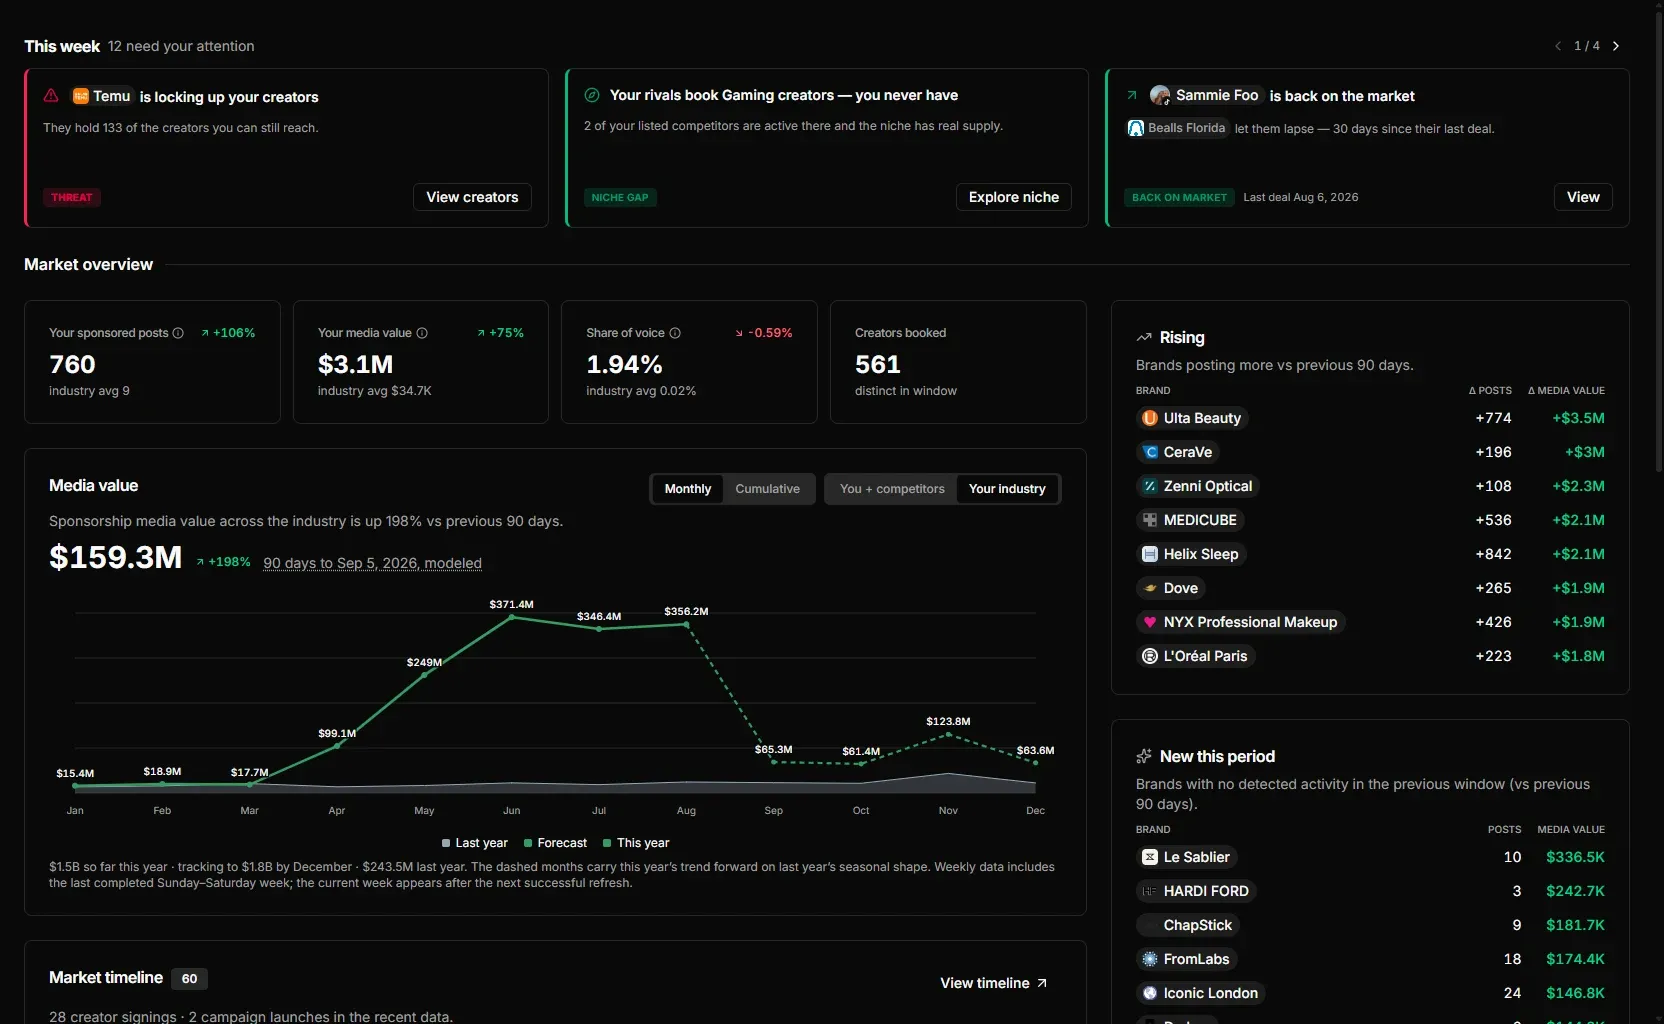
Brand Watcher in Streamforge Intelligence. The market overview puts a brand’s sponsored posts, media value and share of voice next to the industry average, and the side panels list which competitors are posting more and which are new to the market.
Benchmarking and market research strategies
A benchmark needs a denominator. Campaign reporting tells a brand what its own creators delivered; it says nothing about whether that output is above or below what the category is spending to achieve. Competitive benchmarking supplies the comparison by tracking the same measures across every brand in the category: how many creators are active for each brand, how the activity splits across platforms and formats, how much of it is sponsored versus organic, and what the resulting content is worth on a consistent valuation basis.

With that data in one place, market standing becomes a set of quantities instead of an impression. A brand can state its share of sponsored creator activity in the category, its share of estimated content value, and how both have moved over a chosen window. Category benchmarks also show whether an in-house engagement result is strong or ordinary, because the reference point is the sponsored content of every competitor over the same period rather than an industry average built from unrelated verticals.
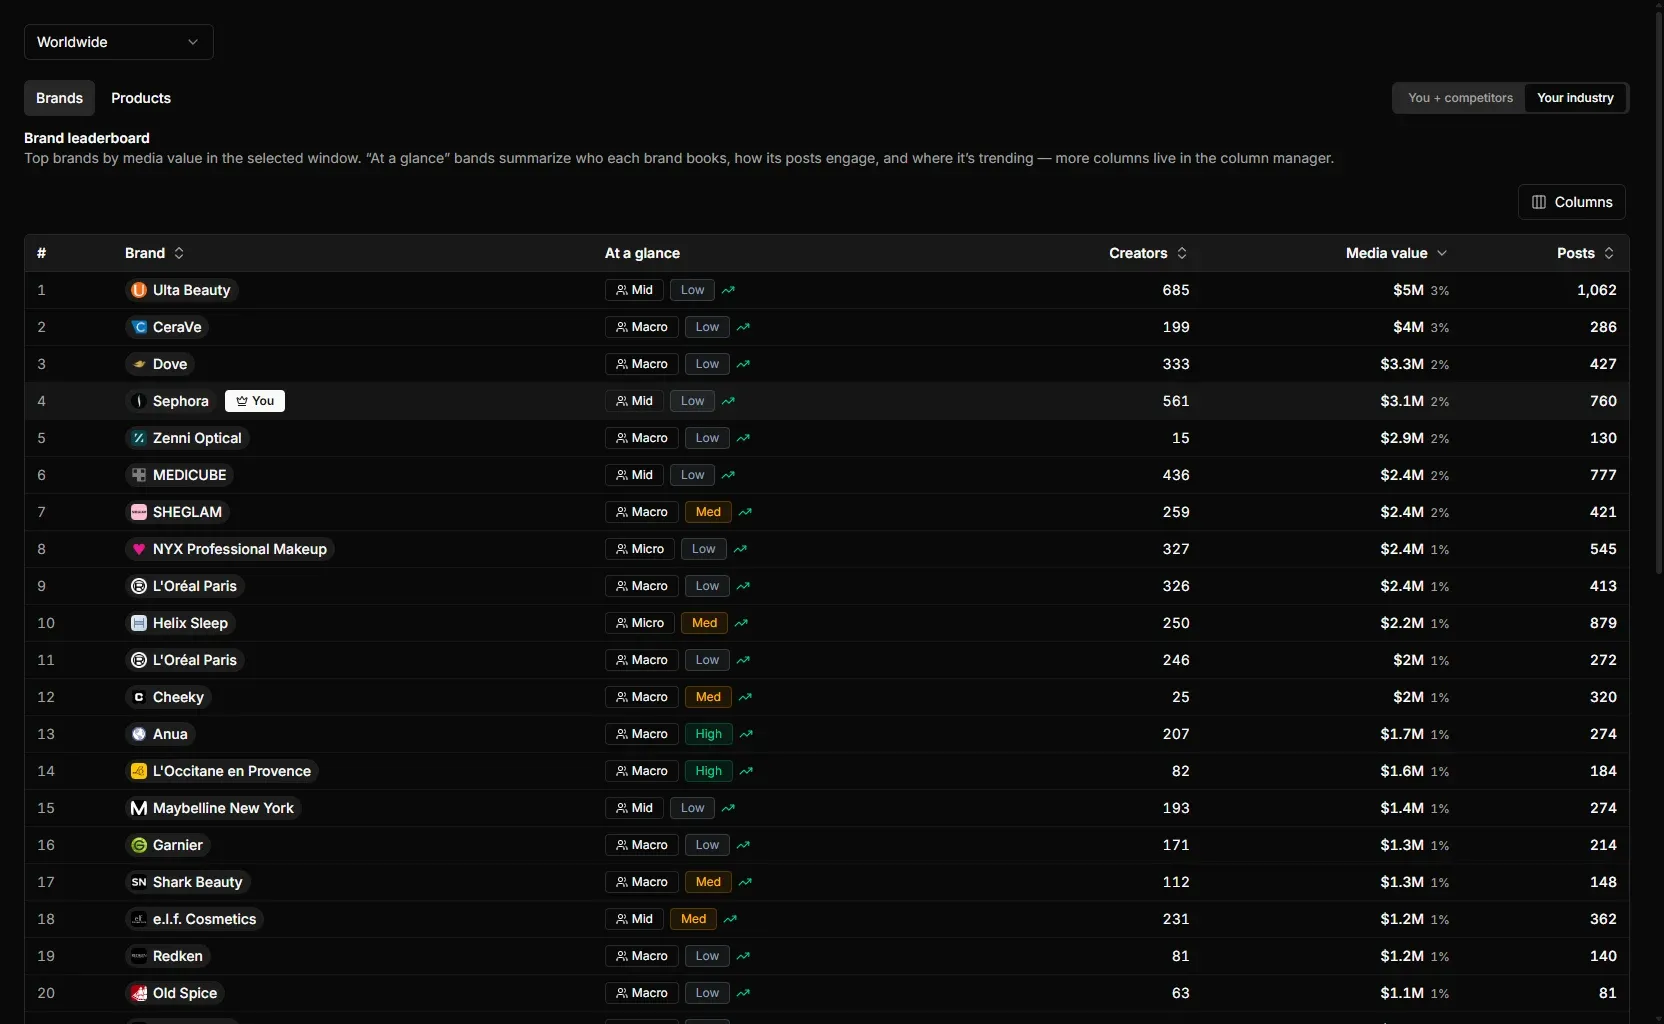
The brand leaderboard ranks every brand in a category by media value over the selected window, with creators booked and posts beside it, so market standing is a rank and a number rather than an impression. Content valuation is what makes the comparison across brands fair. Each brand’s coverage is valued on the same basis, so a competitor spending on Twitch streams and a competitor spending on YouTube shorts can be set beside each other in one currency. Industry reports carry the category view: benchmarks by category, sponsored against organic, trend data and audience patterns over a window.
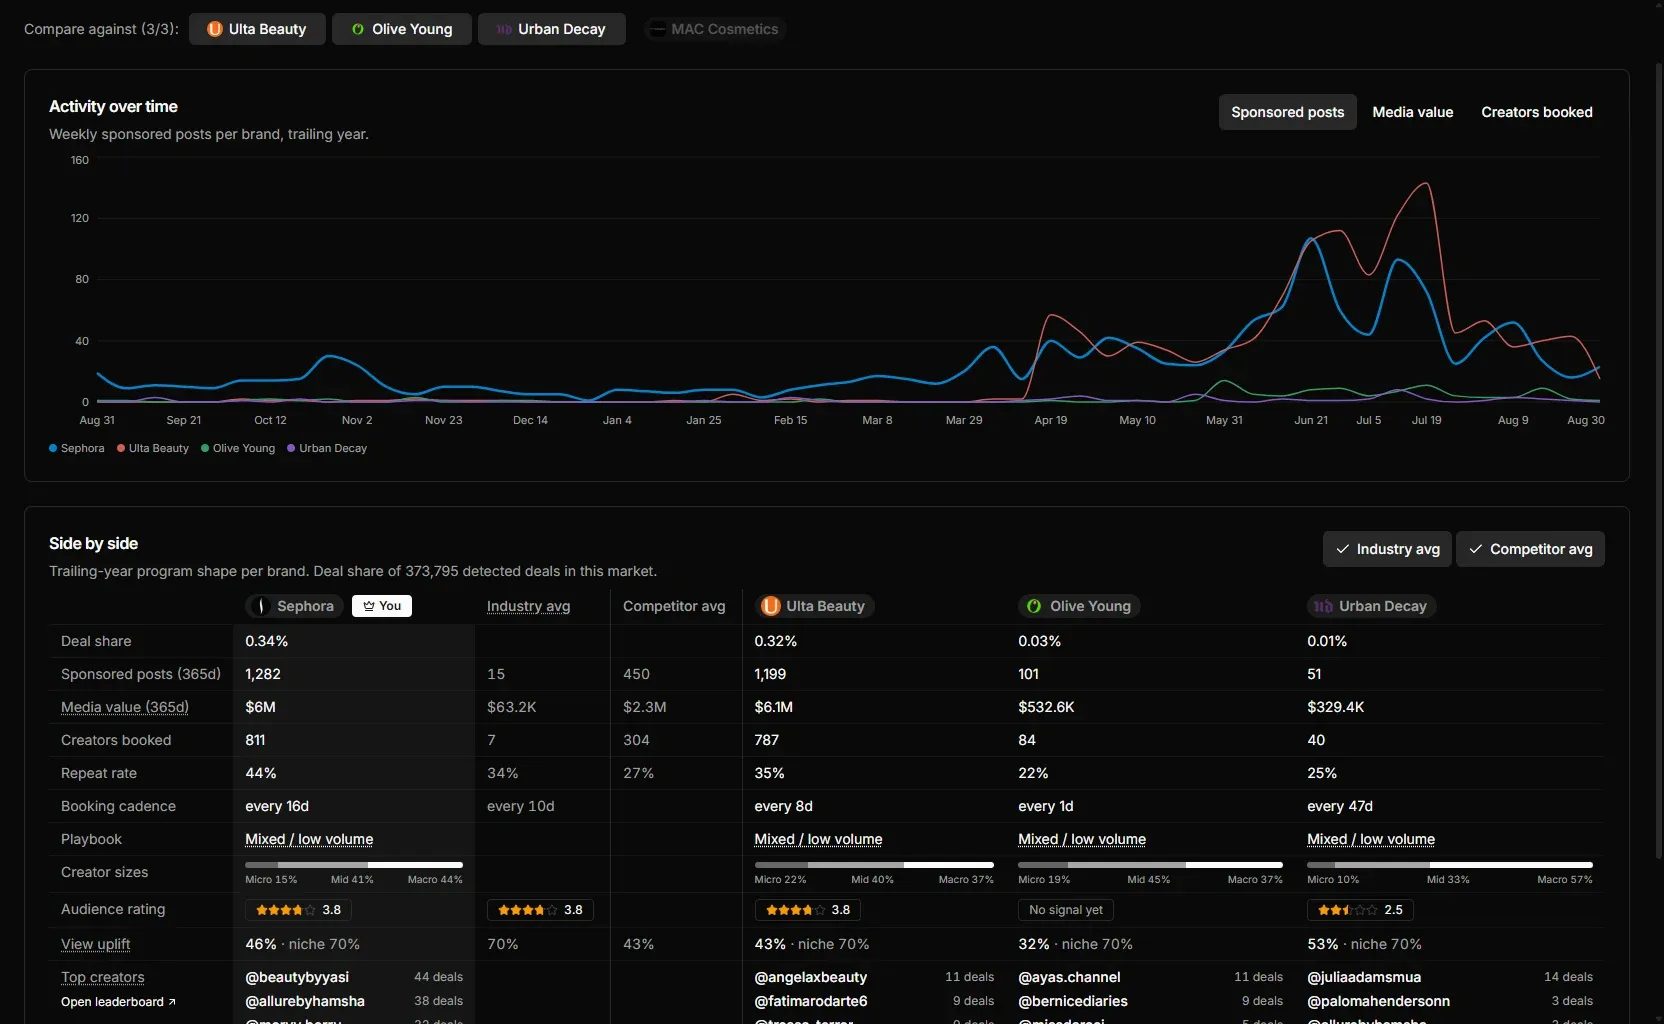
The comparison view sets up to four brands side by side on the same measures: sponsored posts, media value, creators booked, repeat rate, booking cadence and creator size mix, each against the industry and competitor averages.
Sponsorship intelligence is also the fastest route to whitespace. Laying each competitor’s creator portfolio side by side exposes three patterns:
- Shared creators. Creators sponsored by two or more competitors. These audiences are already saturated with category messaging, and a new entrant pays a premium for diminishing attention.
- Exclusive creators. Creators that only one competitor works with, often on a recurring basis. These reveal which communities a competitor treats as strategic.
- Uncovered creators. Relevant creators, by content topic and audience, that no competitor has activated. This is the gap a portfolio can grow into without bidding against the category.
The third group is only visible when the discovery layer and the sponsorship layer share the same creator index. Streamforge Intelligence draws both from the same database of 48M creators, so a whitespace search is a filter on creators that match the brand’s audience and topic criteria and carry no competitor sponsorship record, not a manual reconciliation between two tools. The field guide on finding creators your competitors sponsor sets out the manual version of this process for teams working from public evidence alone.
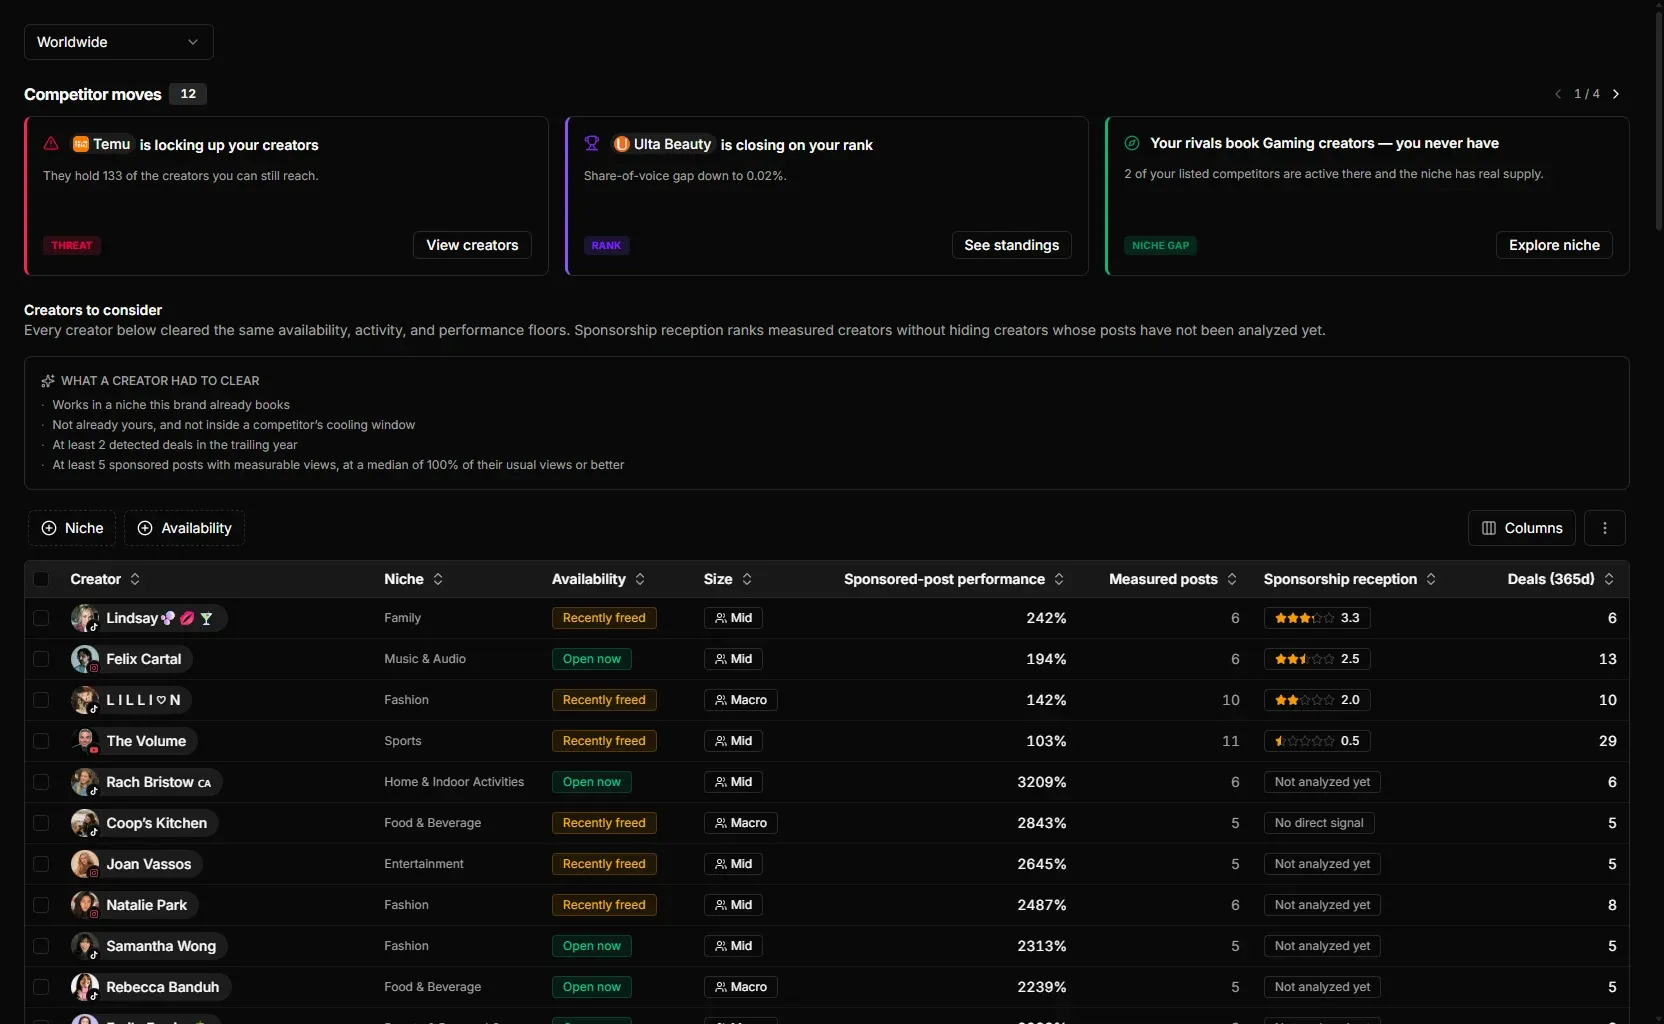
The opportunities view turns the map into a list. Competitor moves flag where rivals are locking up creators or booking a niche the brand never has, and the table below lists creators who cleared availability and performance floors and are not inside a competitor’s cooling window.
Two rules keep a benchmark honest. Compare like with like: a competitor’s TikTok output should be measured against your TikTok output, not your whole program. And keep the window fixed: a benchmark that moves its date range between reports cannot show a trend. The guide on comparing influencer performance fairly applies the same discipline at the creator level.
Analyzing competitor creator partnerships
Mapping a competitor’s partnerships starts with classifying content, not counting hashtags. A brand mention in a creator’s video can be a paid sponsorship, an affiliate arrangement, the creator promoting a business they own, or an organic reference. Streamforge’s sponsorship detection method evaluates native paid-partnership flags, disclosure language across multiple languages, named brands, promotional codes and links, and the surrounding context, then classifies the relationship before deciding whether the content counts as sponsored. The output for each competitor is a roster of creators with the relationship type, platform, format and date of every piece of evidence behind it.
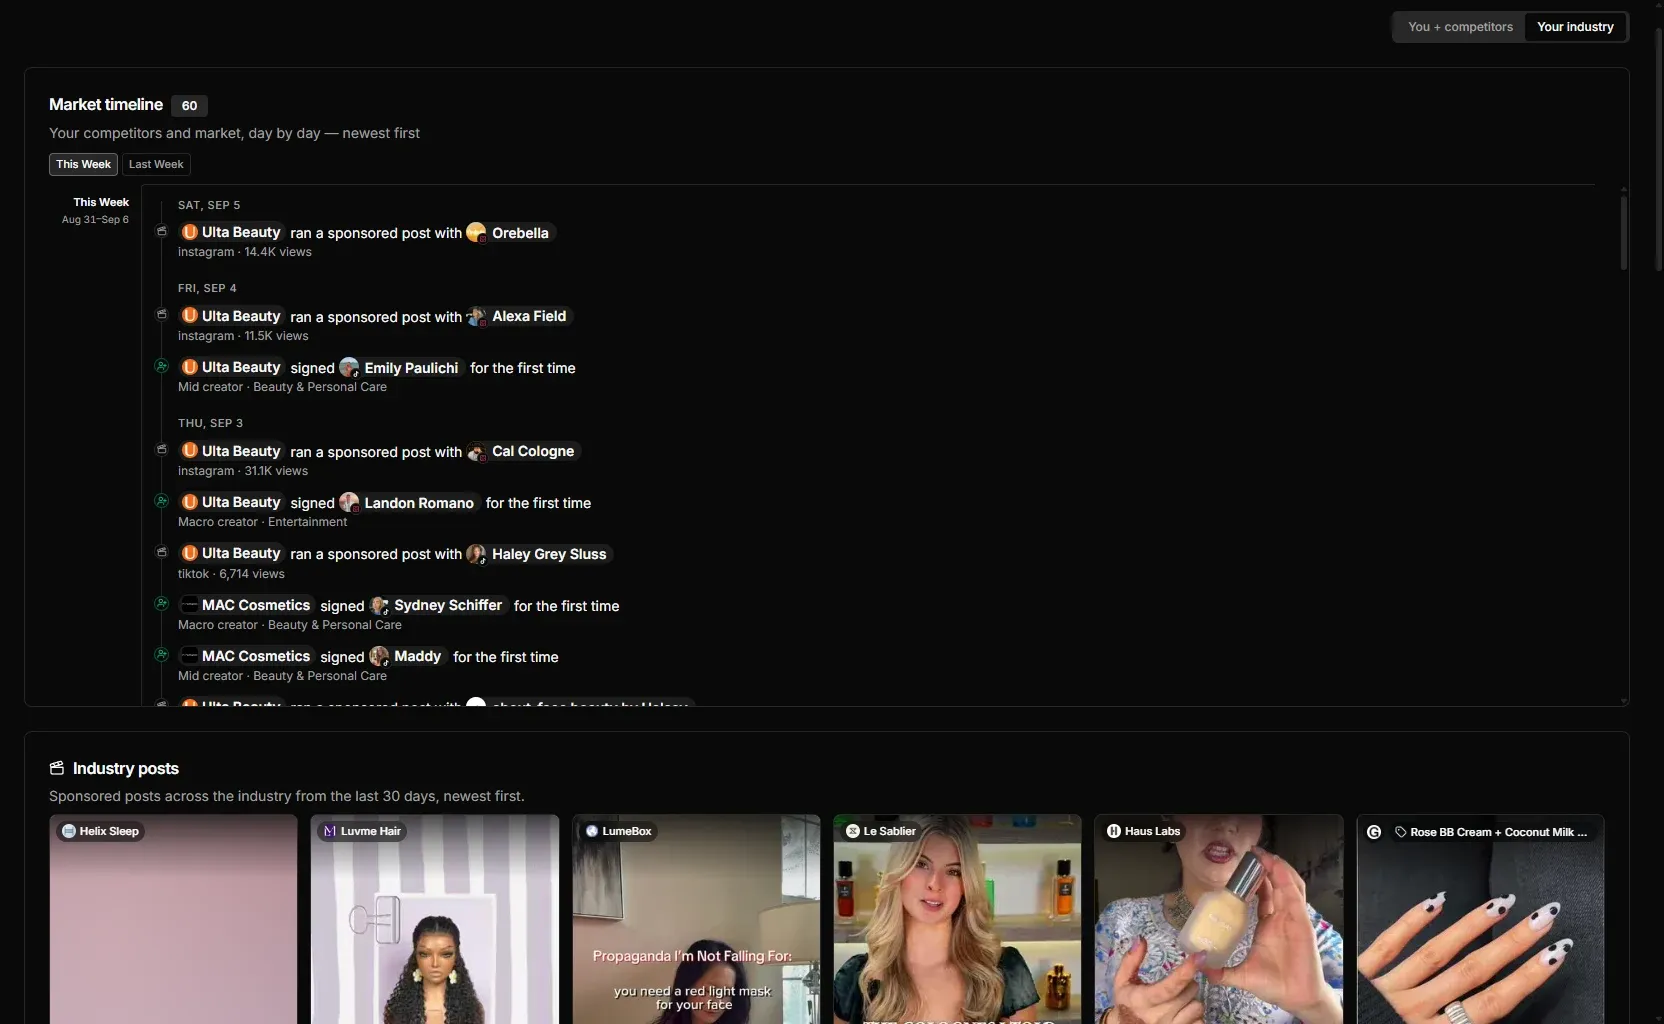
The market timeline is that roster as a feed: each entry names the competitor, the creator, whether it was a sponsored post or a first-time signing, the platform and the views, newest first.
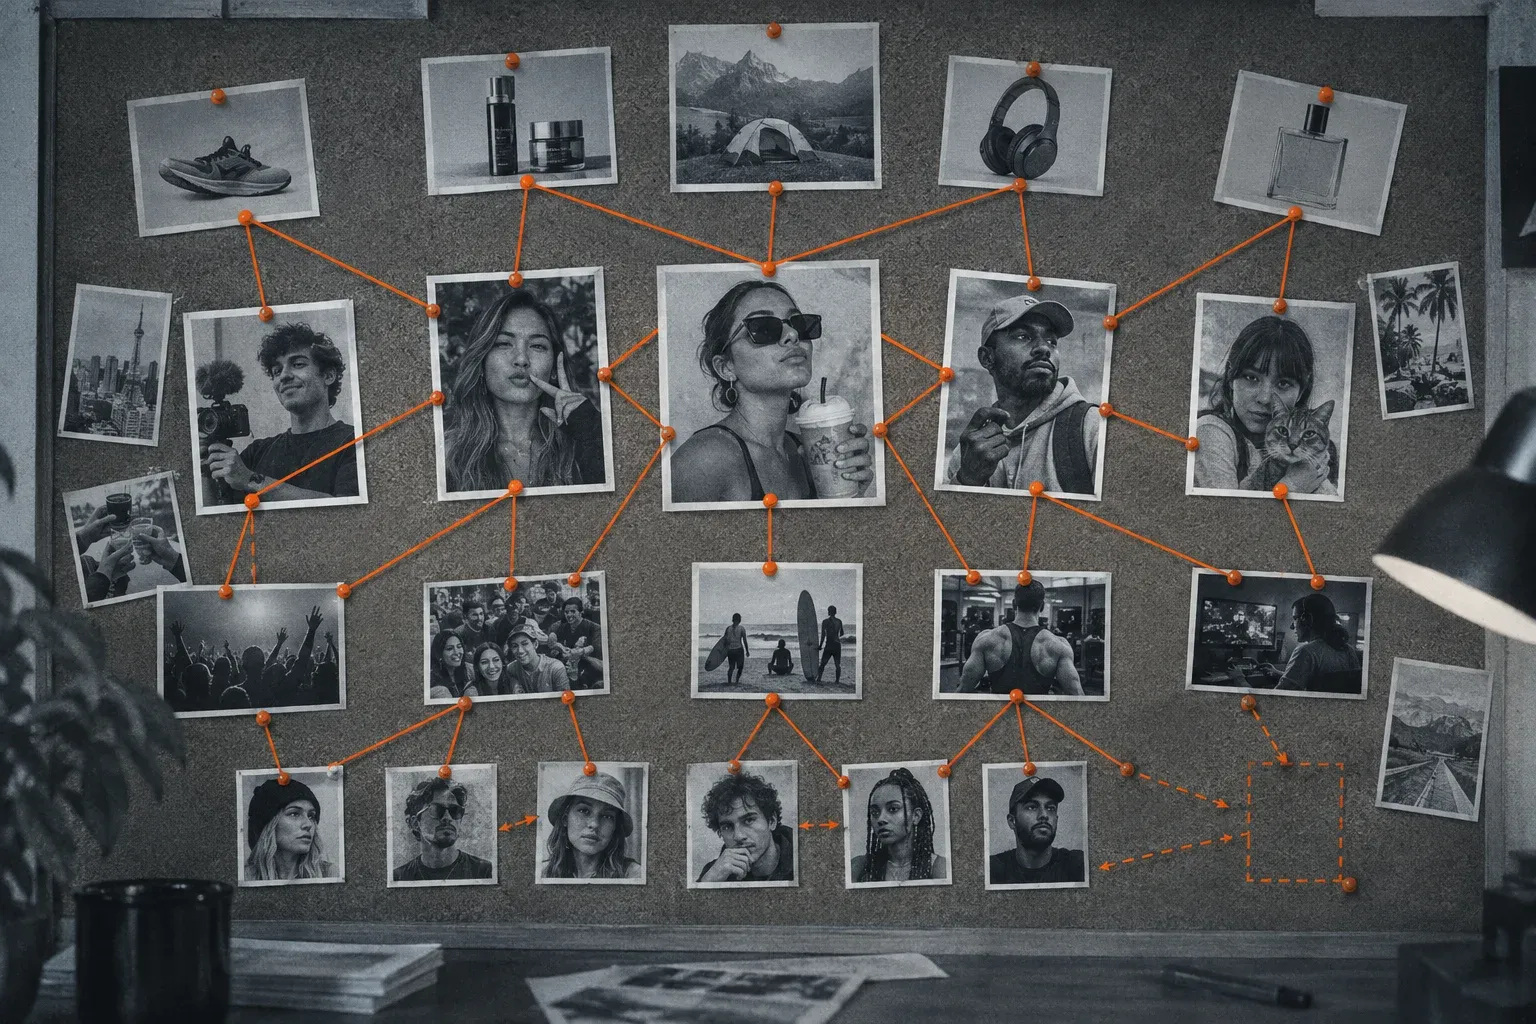
This is where searching by brand mention earns its place in a discovery workflow. Querying for creators whose recent content talks about a competitor’s brand or product surfaces existing partnerships that a competitor never announced, along with the organic advocates who mention the product unpaid. The first group informs conflict checks and outreach priorities. The second is often the cheaper partnership, because the creator already holds the affinity a sponsorship is meant to buy.
Coverage spans the platforms where sponsorships actually run. Brand tracking in Streamforge Intelligence captures paid and organic mentions across YouTube, Twitch, TikTok, Instagram, and X, and the competitive view rolls that up into every activation, every platform, and the spend pattern behind it for each brand tracked.
Audience overlap is the second question a partnership map should answer. Knowing that a competitor sponsors a creator is only useful alongside knowing whether that creator’s audience is the one your brand needs. Audience analysis is supported across YouTube, Twitch, TikTok, Instagram, and X, and it runs at the creator level, so a brand can compare the audience composition of its own roster against the audience composition of a competitor’s roster: demographic profile, geography and language, interests and affinities, and where the two coincide. High overlap between two rosters means both brands are paying to reach the same people, and the incremental reach of matching a competitor’s creator is small. Low overlap with a competitor’s exclusive creators points at a community the competitor has chosen and your brand has not.
The metrics available for comparing engagement across competitor creators are content-level rather than profile-level. For every video, stream and post, the platform records engagement stats, view counts and watch time at the latest available reading, alongside the sponsorship classification for that item. That combination makes two comparisons possible that profile averages cannot support: sponsored versus organic engagement for the same creator, and sponsored engagement for one competitor’s creators against sponsored engagement for another’s over the same window. Engagement is reported as counts, so a rate can be computed against followers, reach or views depending on the question; the guide on calculating influencer engagement rate explains when each denominator is appropriate and why rates with different denominators should never be compared directly.
Three cautions apply to any competitive map. Public evidence classifies a relationship; it does not reveal a contract, a fee, or an exclusivity window. An old sponsored post is not proof of a current relationship, so every finding carries a date. And freshness depends on the source, platform, creator, and field, so a roster should be read as evidence observed on a date rather than a live feed of a competitor’s deal flow. Within those limits, a partnership map built from classified content gives a brand something a spreadsheet of hashtag searches never can: a view of the competitor’s program that is complete enough to plan against.